Monte Carlo Simulation and Data Analysis
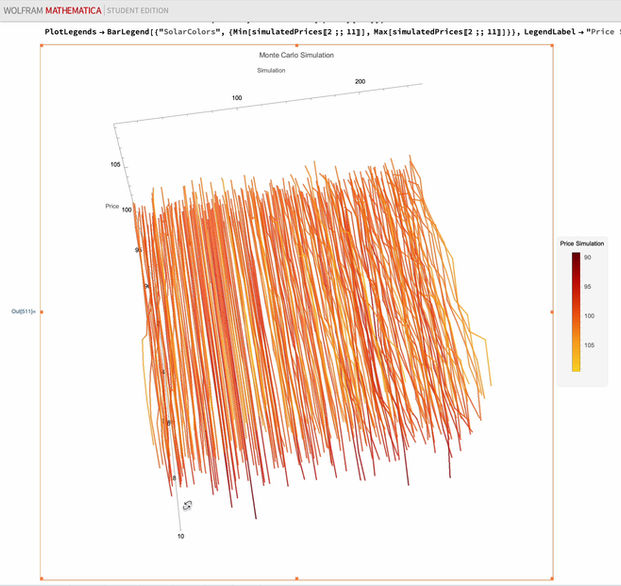
This portfolio section showcases the implementation of a Monte Carlo simulation for generating simulated price paths based on geometric Brownian motion. The simulation calculates the price paths of an asset over a specified time horizon using parameters such as initial price, drift, volatility, time horizon, and the number of simulations. The code utilizes the monteCarloSimulation function to generate an array of simulated price paths. Additionally, the section includes visualizations to enhance understanding. These visualizations consist of a 3D plot displaying the simulated price paths over time, a line plot showing selected simulations' price trajectories, a line plot depicting the rolling mean of the simulated prices, and a matrix plot illustrating the correlation matrix of the price data. The Monte Carlo simulation can generate simulated price paths based on geometric Brownian motion, allowing businesses to forecast the potential future prices of financial assets. This can be useful for investment analysis, portfolio optimization, risk management, and option pricing.


